





















In February 2021 Peloton told its customers that transport would cost more than ten times its usual amount per item, and set aside $100 million to fix late deliveries, as Supply Chain Dive reported. That one budget line sets days against price, the core of the air freight vs sea freight choice.
February 2021: $100 million to buy back time
The company listed four uses for the money: airfreight, expedited ocean freight, shifting containers to less congested ports, and getting product into US warehouses. West Coast port congestion was one cause of the delays. Part of the sum also covered higher container rates from Asia to the West Coast, which Freightos put at $4,334, nearly triple the $1,486 of a year earlier. Peloton said it would keep using standard ocean freight. Air for bikes and treadmills would not be permanent.
Chief financial officer Jill Woodworth called the spend “a very large investment”, then pointed out that shipping was only 2% to 3% of cost of goods sold, easy to absorb from a margin perspective. She expected the outsized costs to fade by June, once inventory was built up inside the US.
November 2026: how long the ocean leg of that trade takes now
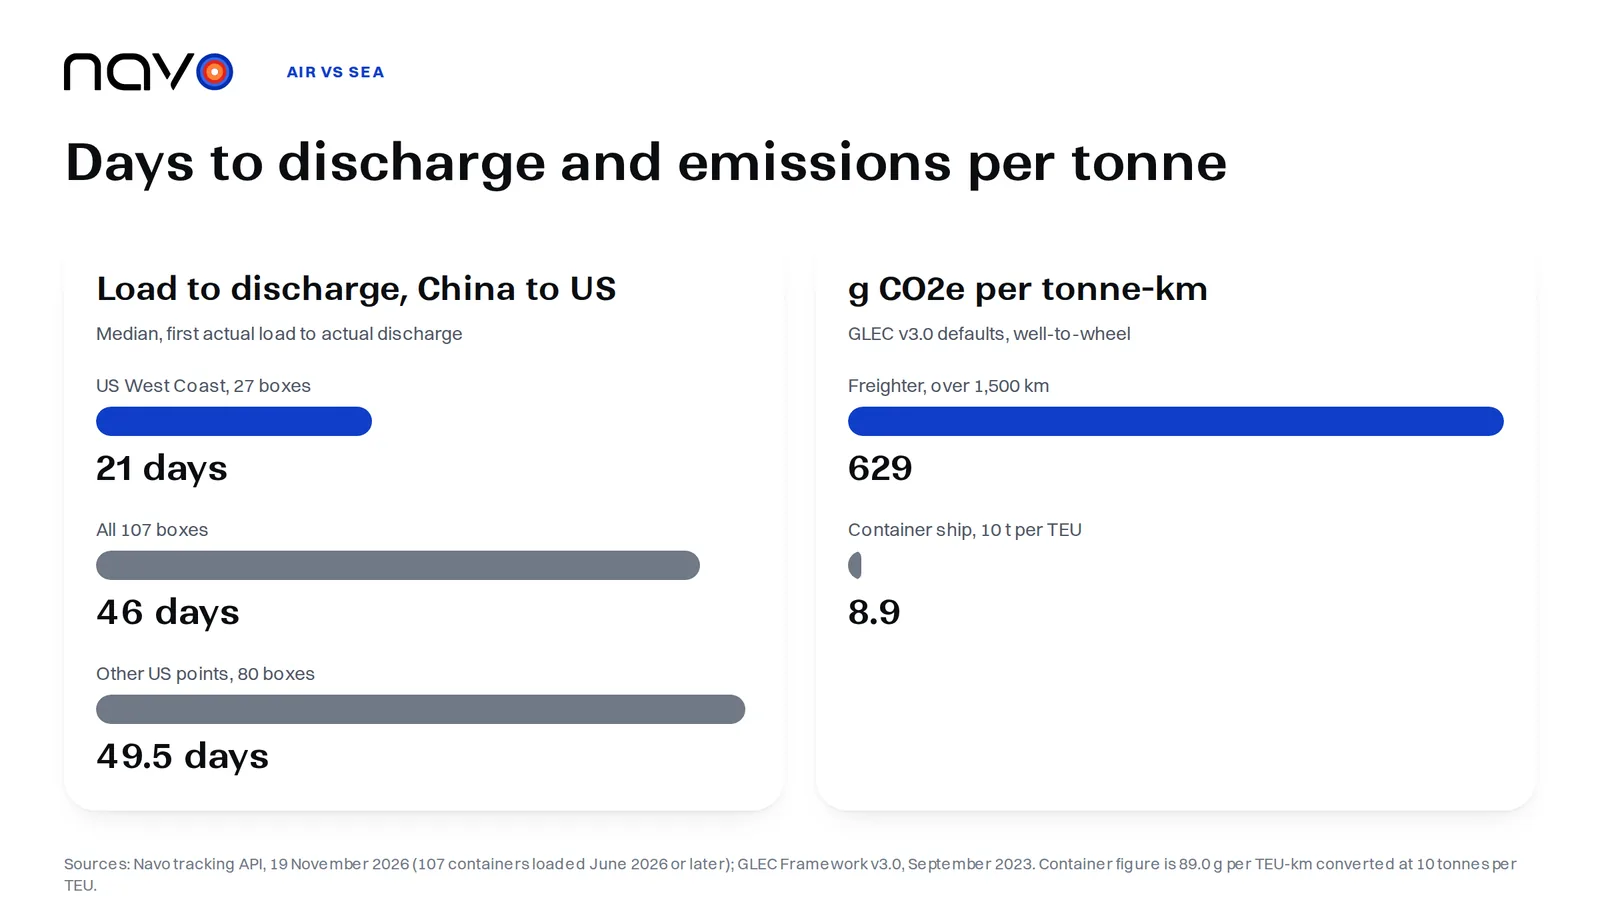
Peloton was buying days. The Navo tracking API returned 107 containers on 19 November 2026 that sailed from a Chinese port to a US port, were loaded in June or later and have already been discharged at destination, so only completed voyages are counted and the slowest recent boxes are missing. From the first actual load event to the actual discharge event the median was 46 days, the shortest 15 and the longest 81.
The destination explains much of the spread. The 27 boxes that landed at Los Angeles, Long Beach or Tacoma had a median of 21 days and none took longer than 48. The other 80, mostly to Houston, Charleston and Chicago (an inland rail point, so its days include the rail leg), had a median of 49.5 days and a range of 27 to 81. Those are different voyages and routings as well as different ports, so the figures do not isolate congestion. They do show why Peloton paid to move containers between ports: for a sea shipper the destination can shift the arrival by weeks before any question of air arises.
Emissions per tonne: GLEC defaults
The emission factors below come from the Global Logistics Emissions Council. In its GLEC Framework v3.0 of September 2023, a freighter on a flight longer than 1,500 km has a default of 629 g CO2e per tonne-km, well-to-wheel. The industry average for a dry container, which GLEC says to use when the origin and destination are unknown, is 89.0 g CO2e per TEU-km well-to-wheel. Trade-lane values for dry boxes in the same table differ, for example 55.6 on Trans-Suez and 112.1 on the Panama trade.
The units do not match. Convert first. The framework gives the bridge: where only the TEU count is known, assume 10 tonnes per TEU. That turns the container figure into about 8.9 g per tonne-km, so on v3.0 defaults the freighter emits roughly 70 times more per tonne moved. GLEC also allows 6 tonnes for light containers and 14.5 for heavy ones, which moves the ratio to about 42 times and about 100 times. Both factors are per kilometre, and the distance each mode travels between two ports is not the same, so the gap per shipment differs from the per-kilometre ratio. GLEC has since issued v3.1 and v3.2, and the ratio will move with them, so check the current edition before quoting it in a report.
What the contract and the cargo settle before the rate does
A sea shipment needs a contract term first. Start there. The introduction to Incoterms 2020 from the International Chamber of Commerce, available from ICC Switzerland, says that under CFR, CIF and FOB delivery happens when the goods are placed on board the vessel at the port of loading, and risk travels with delivery. The CIF seller still pays freight and buys insurance. The buyer carries the risk of the voyage. The Navo sample above has a median of 46 days from loading to discharge on the China to US lane. ICC also advises that for containerised goods handed to a carrier before loading, the seller is better advised to sell on FCA terms than on FOB. The default policy under CIF is Institute Cargo Clauses (C), which cover listed risks, and the parties may agree on more.
Cargo type can complicate air or rule it out with a given airline. It changes the air freight vs sea freight question before any quote. IATA’s dangerous goods page says electronic equipment containing lithium batteries is dangerous goods for air transport, yet may be exempted from formal declaration, with Section II of the applicable packing instruction as the place to check. Paragraph 1.2.4 of the DGR adds that airlines are not obliged to carry a particular product, so a paperwork exemption leaves acceptance to the airline.
Where is the break-even? The weight or value at which air pays for itself is not in any of the documents above. It sits in the shipper’s landed-cost sheet, next to the days of sales lost while the box is at sea.
Frequently asked questions
Which GLEC figure applies when the cargo flies in the belly of a passenger aircraft?
GLEC Framework v3.0 (September 2023) lists belly freight separately from freighters. On flights over 1,500 km the default is 768 g CO2e per tonne-km tank-to-wheel and 971 g well-to-wheel. Under 1,500 km the values are 978 and 1,237. Use them only when the airline gives no data of its own.
Does a reefer container change the emissions gap between air and sea?
In GLEC v3.0 the industry average for a reefer is 172.2 g CO2e per TEU-km well-to-wheel, against 89.0 for a dry box. At the framework's 10 tonnes per TEU that is about 17 g per tonne-km, and a long-haul freighter at 629 g still emits more than 35 times as much.
Does the air emissions factor change on short routes?
Yes. GLEC v3.0's default for a freighter under 1,500 km is 1,509 g CO2e per tonne-km well-to-wheel, against 629 g over 1,500 km. GLEC's own text calls the 1,500 km split a simplification, since air intensity varies steadily with distance.