





















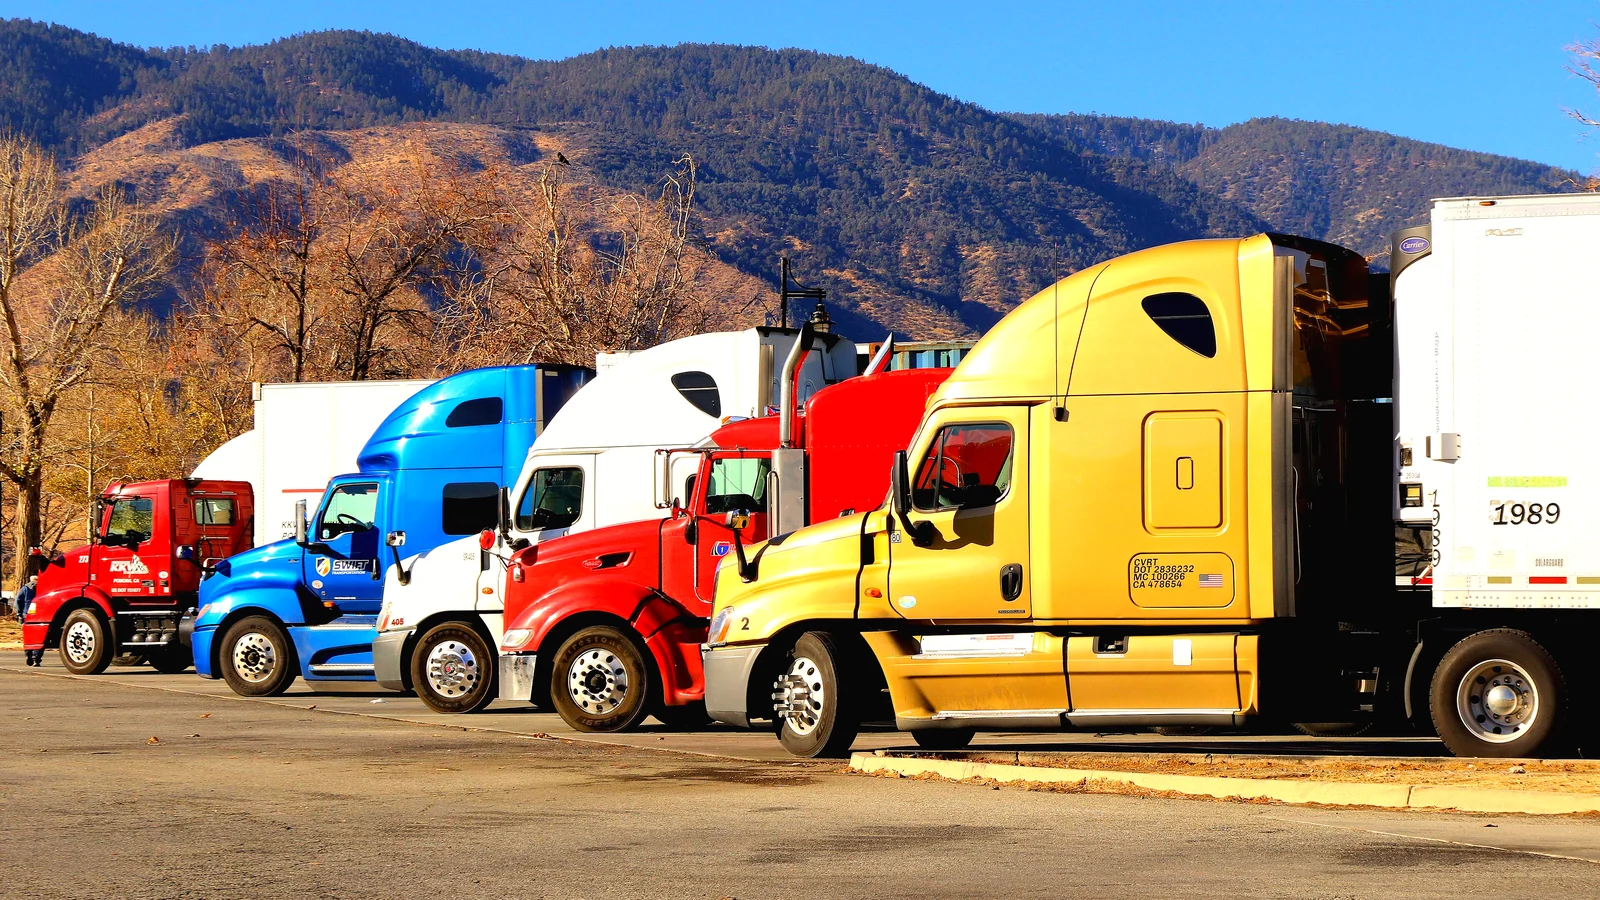
Yellow Corporation stopped moving freight on July 30, 2023, and about 30,000 people lost their jobs. Trucking Dive counts 22,000 of them as Teamsters, which made Yellow the largest union employer in less-than-truckload hauling. The carrier ranked third in its segment, owed the Treasury a $700 million COVID-19 relief loan and had grown by buying other carriers that it never fully integrated. Yellow and 23 affiliates filed Chapter 11 petitions in Delaware on August 6 and 7, 2023, the largest bankruptcy the trucking business had seen.
Yellow blamed the Teamsters for stalling its restructuring plan and put the cost of that delay at more than $137 million in adjusted EBITDA. A judge cleared the final liquidation plan in November 2025, with a distribution of as much as $700 million to the remaining creditors.
Most carriers are nothing like Yellow
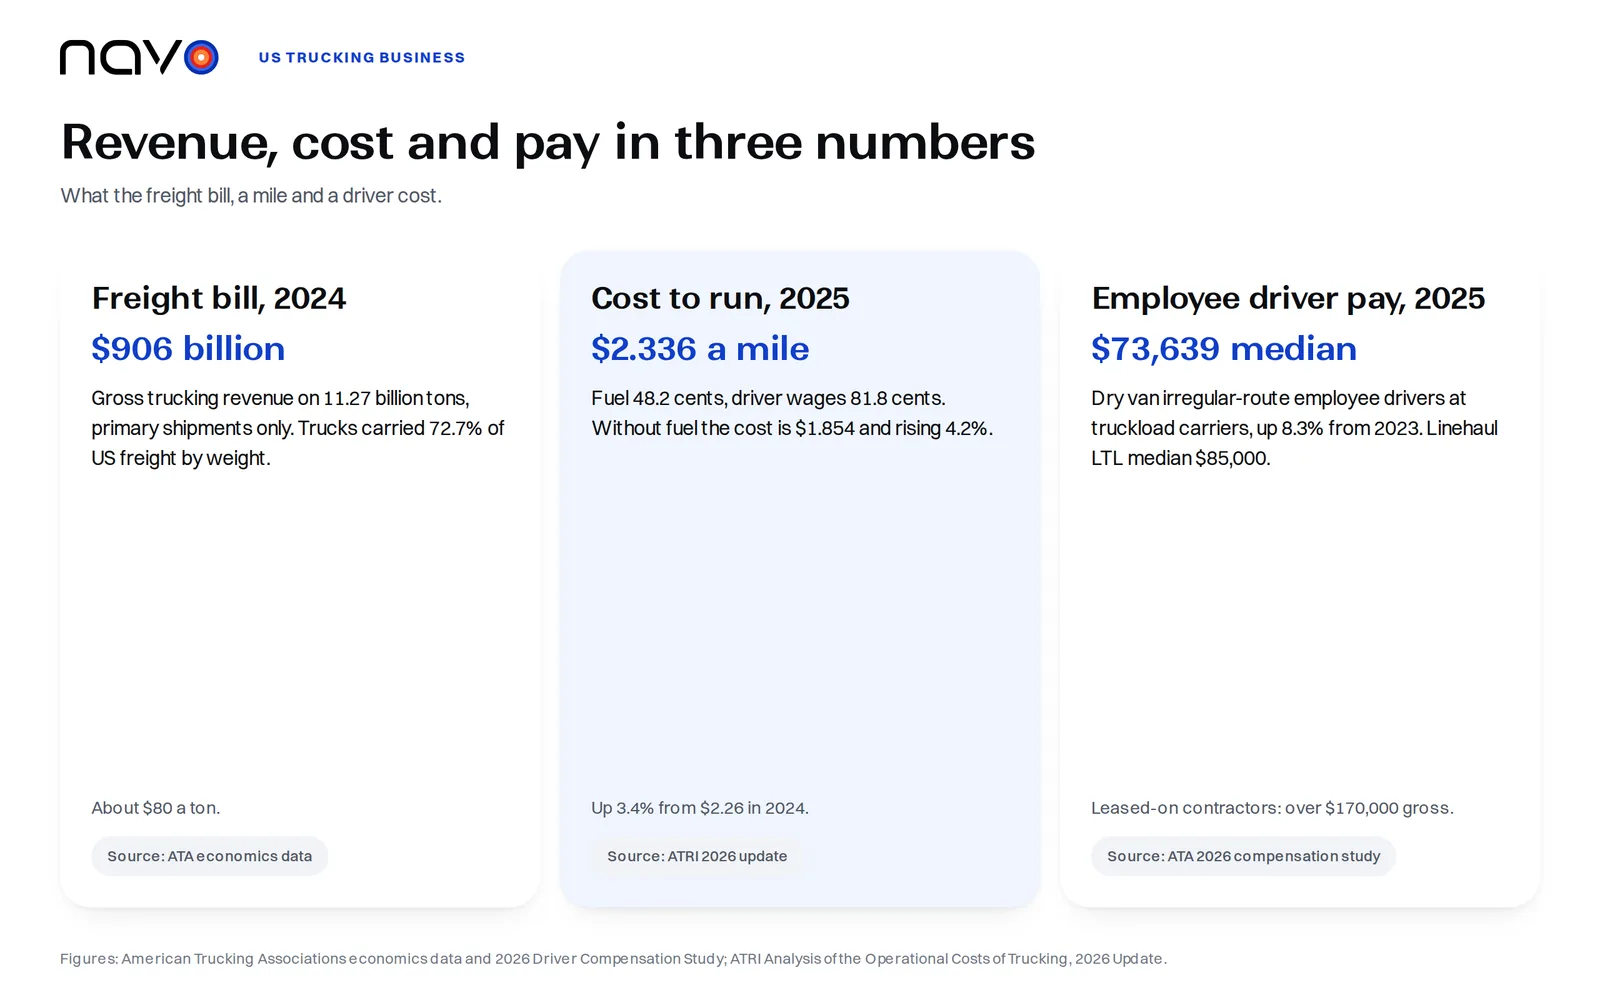
By number of carriers, the trucking business is made of small firms. The American Trucking Associations put the 2024 freight bill at $906 billion in gross revenue for 11.27 billion tons, about $80 a ton on primary shipments, and trucks moved 72.7% of US freight by weight. By value, trucks carried 67% of surface trade with Canada and 85% with Mexico.
Almost 580,000 active motor carriers were counted by the federal motor carrier regulator in June 2025, as firms that own or lease at least one tractor. Of them, 91.5% run 10 trucks or fewer, and 99.3% run 100 or fewer.
What a mile costs to run
The American Transportation Research Institute surveyed for-hire carriers between February and May 2026, covering 182,248 tractors, about their 2025 costs. Their answers average $2.336 per mile, up 3.4% from $2.26, the highest in the report’s history. Fuel barely moved, from 48.1 cents to 48.2, so the rise sits in everything else: $1.854 a mile without fuel, up 4.2%. Repair and maintenance climbed 8.6%, insurance 3.9%, truck and trailer payments to 40.4 cents from 39, and driver wages to 81.8 cents, up 2.5%.
Divide those lines and a pattern shows. Driver wages are 35.0% of a mile, fuel 20.6%, and the remaining 44.4% (about $1.04) is the truck, its insurance and its upkeep. A carrier that wants to cut cost per mile has little to squeeze in the part everyone watches, the fuel line.
To put those averages on real roads, we pulled five lanes from Navo24’s road distance API on 14 November 2026. None came back marked as an estimate. The cost columns are arithmetic on ATRI’s fleet averages, so a carrier’s own quote will differ.
| Lane | Road miles | Driving hours | API duration | Cost at $2.336 a mile | Driver wages |
|---|---|---|---|---|---|
| Atlanta to Chicago | 759 | 11.7 h | 22.7 h | $1,773 | $621 |
| Dallas to Atlanta | 787 | 12.1 h | 23.1 h | $1,838 | $644 |
| Chicago to Dallas | 966 | 14.9 h | 25.9 h | $2,256 | $790 |
| Seattle to Denver | 1,303 | 27.1 h | 49.1 h | $3,043 | $1,066 |
| Los Angeles to Dallas | 1,438 | 29.7 h | 62.7 h | $3,359 | $1,176 |
Each response carries two clocks. Chicago to Dallas has 14.9 driving hours inside a 25.9-hour duration, Los Angeles to Dallas 29.7 inside 62.7. The API does not label the difference. FMCSA’s hours-of-service rules allow 11 hours of driving after 10 hours off duty, so 14.9 driving hours need at least one such break. Add 10 to 14.9 and you get 24.9, close to the 25.9 shown. Los Angeles to Dallas needs at least two breaks, 29.7 plus 20 is 49.7, and the API shows 62.7, so its clock holds more than the minimum rest. A per-mile price has no room for either.
Margins show how thin the cushion is. ATRI’s 2025 operating margin for truckload carriers was 0.4%, which puts revenue that merely covers the average cost at about $2.345 a mile. On Chicago to Dallas that is roughly $2,265, against $2,256 at the plain average cost.
Driver pay and what carriers keep
The per-mile cost has a human side too, and the ATA put numbers on it. The ATA’s 2026 Driver Compensation Study covers more than 130 fleets, with over 140,000 employee drivers and 9,000 independent contractors. A dry van employee driver on irregular routes at a for-hire truckload carrier made a median $73,639 in 2025, up 8.3% from 2023. Linehaul LTL drivers made $85,000, local LTL drivers $72,942. Leased-on independent contractors at truckload carriers took in more than $170,000 in median gross annual compensation, a figure the ATA labels gross. Seventy-four percent of the surveyed truckload carriers paid drivers for excessive waiting.
Carriers kept very different amounts by sector. ATRI’s 2025 operating margins were 11.6% for LTL, 4% for tank, 0.6% for refrigerated, 0.4% for truckload and -0.5% for flatbed, and truckload had lost 2.3% the year before. Carriers cut truck counts 2.4%, the largest capacity cut since the downturn began in 2022, and left another 10% of trucks without a driver on average.
Frequently asked questions
What does the ATRI cost per mile include?
ATRI splits the figure into fuel and non-fuel costs, and its 2026 update lists driver wages, truck and trailer payments, insurance and repair and maintenance as separate lines. Fuel was 48.2 cents of the $2.336 total in 2025.
Do trucking companies pay drivers for waiting?
Most surveyed truckload carriers do. In the ATA 2026 compensation study, 74% of for-hire truckload carriers paid drivers for excessive waiting.
Is the $170,000 owner-operator figure take-home pay?
No. ATA reports it as median gross annual compensation for leased-on independent contractors at truckload carriers, and its release does not say what the contractor pays out of that sum.