





















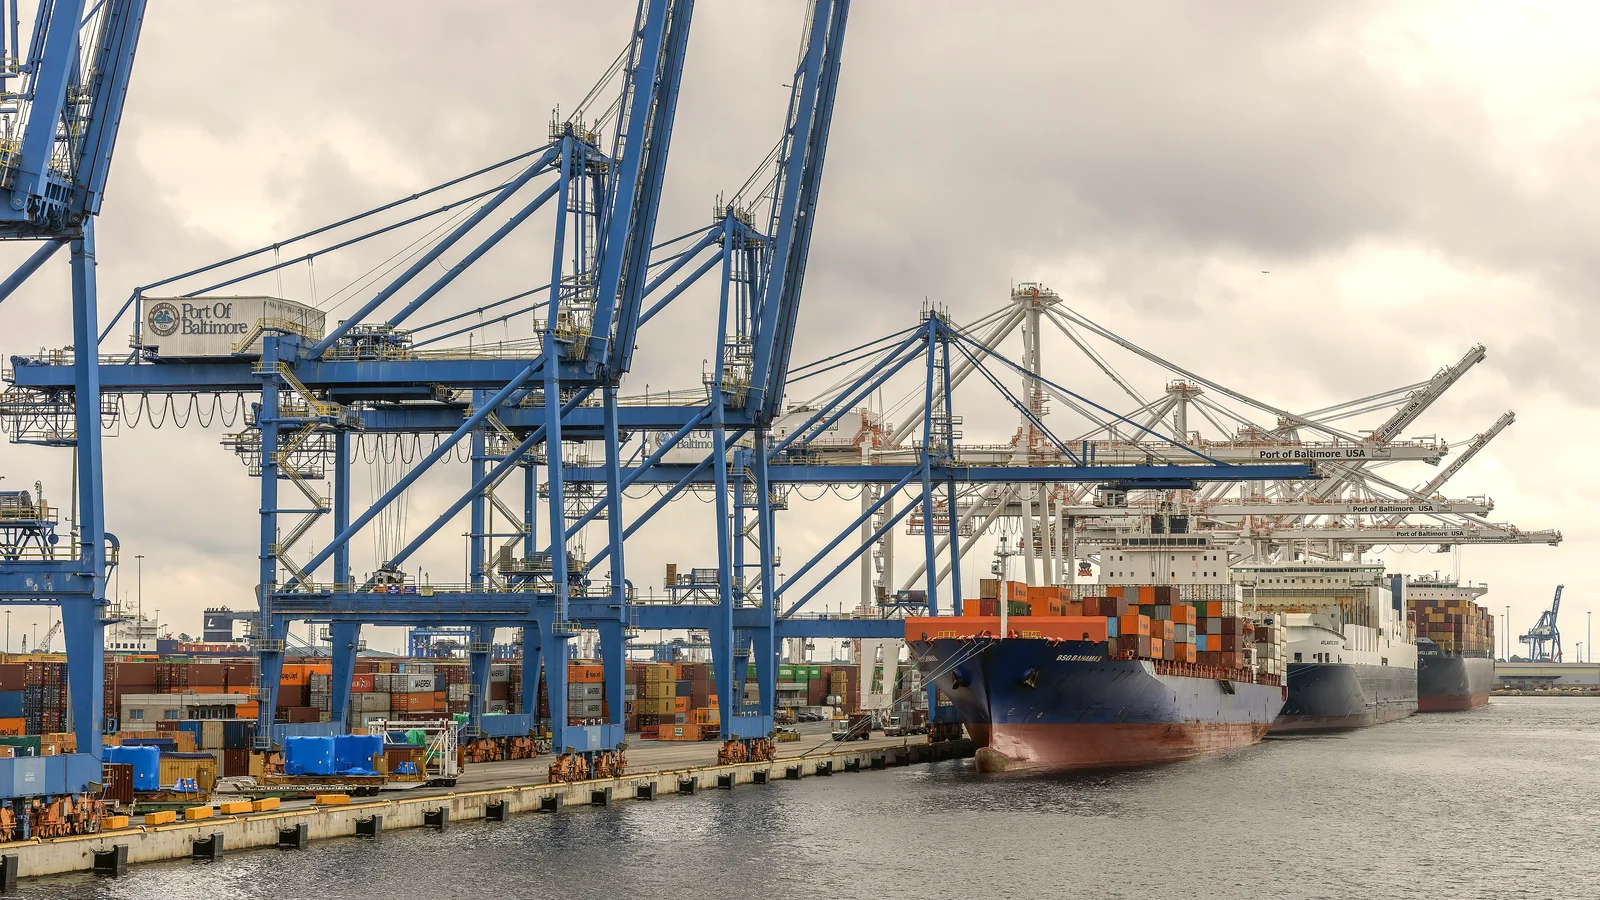
US East Coast container rates are sliding from a record-capacity October. Carriers filled the Far East to US East Coast lane to that record: the 13 November update counts 179,000 TEU of offered capacity a week, 10.9% above last year, and carriers used it to capitalise on elevated rates. The peak came on 22 October. Average spot rates have fallen 2.5% since, to USD 11,249 per 40ft container (FEU). That is USD 73 below last week and still 324.5% above the pre-Hormuz baseline of 28 February.
Peter Sand’s forecast of USD 6,000 to 7,000, set against the 1 October level
Forwarder News recorded Xeneta’s East Coast average on 1 October at USD 11,523 per FEU, citing FreightWaves. Chief analyst Peter Sand said US-bound rates had peaked “but they will not collapse”. His forecast was USD 6,000 to 7,000 for the East Coast and USD 4,500 to 5,500 for the West Coast, a fall of about 39 to 48% on the East Coast.
Sand published the forecast in early October and gave it three months, which runs to early January, about seven weeks from today, and the Red Sea return is already under way. Xeneta expects it to flood capacity back. Six weeks in, the East Coast average is 2.4% down, so Sand’s range needs a further 38 to 47% from here. The West Coast average is USD 8,360 against USD 8,346 on 1 October, so that coast is essentially flat, up USD 14 in six weeks.
Xeneta’s reading of the blanked sailings
In its 16 October update, Xeneta counted 58,200 TEU blanked that week on the Far East to US West Coast trade and 35,500 TEU on the East Coast trade. Blanking cancels scheduled sailings. Senior analyst Emily Stausbøll called it “the telling signal”. With spot rates still up triple-digit percentages on February, carriers would normally add capacity, yet the blanking, she said, “looks like the behavior of carriers who don’t believe the market will hold.” In her reading they were protecting the level, not planning growth.
The same update put East Coast rates at more than three times those into North Europe, and carriers, the update says, “cannot sustain a spread this wide for long.” On 16 October the two stood at USD 11,495 and USD 3,568. Today it is USD 11,249 against USD 3,588, a ratio of 3.1 to 1, so the spread has narrowed only a little. Blanked sailings are cancelled ones, which makes it worth matching each quoted vessel against its published schedule before a tender is awarded.
Less capacity, almost the same price: what the 13 November table shows
Xeneta’s four-week rolling average of offered capacity from the Far East to the East Coast stands at 161,571 TEU, against 179,343 TEU in October. The 13 November table puts that at 9.9% less capacity, while the rate has given up only 2.5% since the peak. West Coast went the other way: capacity rose 1.7% against October to 349,556 TEU, and the rate there is USD 2 below last week.
North Europe shows how the cycle can run. Sand says carriers cut capacity there by more than 10% from mid-October to early November, and short-term rates rose on 19 October, but then “gravity always wins”, in his words, and rates fell back. Capacity is now 7.3% below October and the rate is up 0.3% on the week. For the last six or seven weeks of the year Sand sees demand “easing somewhat”, and Xeneta’s Ocean Outlook 2027 expects softening rates and capacity “flooding back” as services return to the Red Sea.
The two figures use different bases, a four-week capacity average against the 22 October rate peak, so they are not one clean comparison. Read together, the East Coast lane still holds a price near USD 11,000 on capacity that Xeneta puts about a tenth lower, while Sand’s forecast needs a further fall of 38 to 47% in about seven weeks. Xeneta calls these figures important for shippers in the middle of tendering. For a contract on US East Coast container rates that runs into the new year, the practical anchor is the weekly figure, USD 11,249 this week, not the October peak. A review clause lets the price follow the market if Sand’s range arrives, and the forwarder can be asked to name the vessel behind each quote.